What the Duck is DuckDB?!
Let's dig into what DuckDB is and why there's so much hype around it.


DuckDB is the new kid on the (database) block and I'm not mad about it. Over the past couple of years, DuckDB has gained a lot of traction within the data community – and for good reason. First released in 2019, DuckDB uses a state-of-the-art SQL query processing engine rooted in academic research. In fact, it started off as a research project by PhD student Mark Raasveldt and his supervisor Hannes Mühleisen at a research institute in the Netherlands — the same place where Guido van Rossum, the creator of Python, once worked. It has since spun off into a company called DuckDB Labs and is used by big tech companies like Google, Airbnb, and Meta.

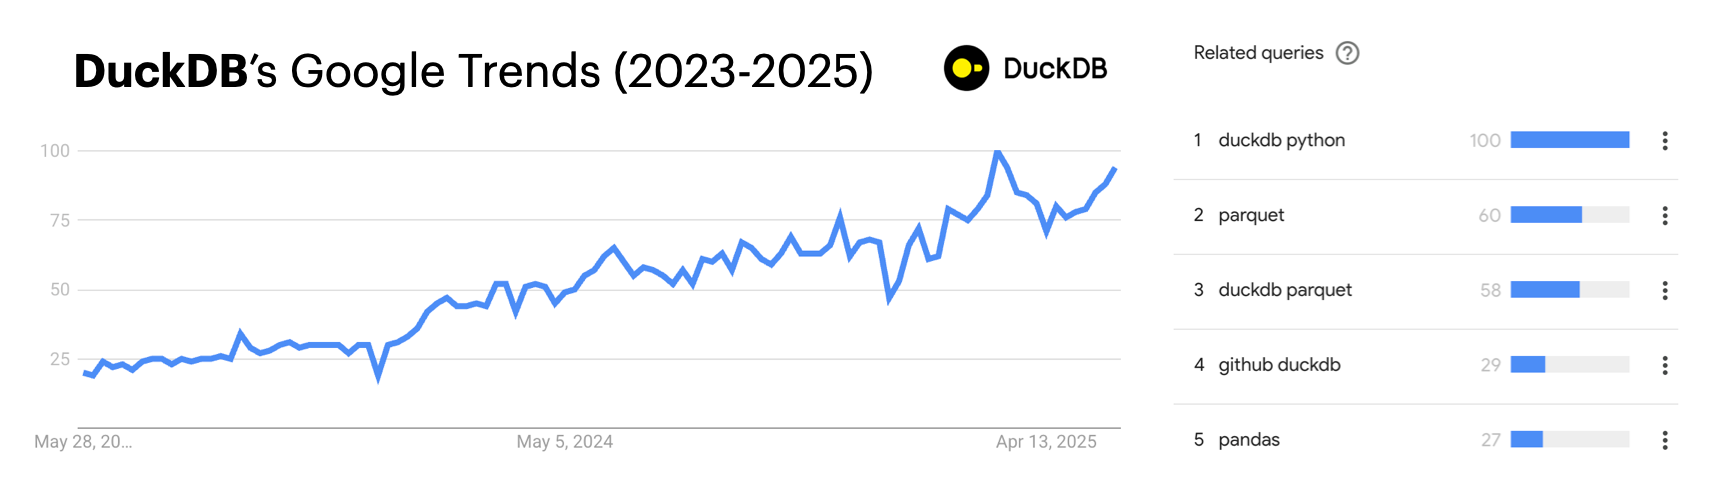
DuckDB is often discussed in the context of Python, but it's not tied to any single language. As a database, it's language-agnostic and offers client APIs in C, Node.js, R, and Rust, to name a few. That being said, Google Trends shows Python as the leading topic related to DuckDB, which makes sense since DuckDB is tightly integrated with the Python ecosystem.
Under the Hood
So, what is DuckDB exactly? DuckDB is a column-oriented in-process online analytical processing (OLAP) relational database management system (RDBMS). What a mouthful! Let's break this down into more digestible pieces:
- It’s an in-process or “embedded” database which means that it runs within the same process as the application using it. Unlike traditional databases, there’s no need to set up a separate server for your DuckDB database. This makes it super easy to get things up and running inside a Jupyter notebook.
- It's an online analytical processing database which means that DuckDB is optimized for performing complex analytical queries on large multi-dimensional data. As an OLAP database, DuckDB is not ideal for real-time transactional queries (e.g., inserting or updating records). For transactional data, an online transactional processing (OLTP) database such as SQLite is the better option.
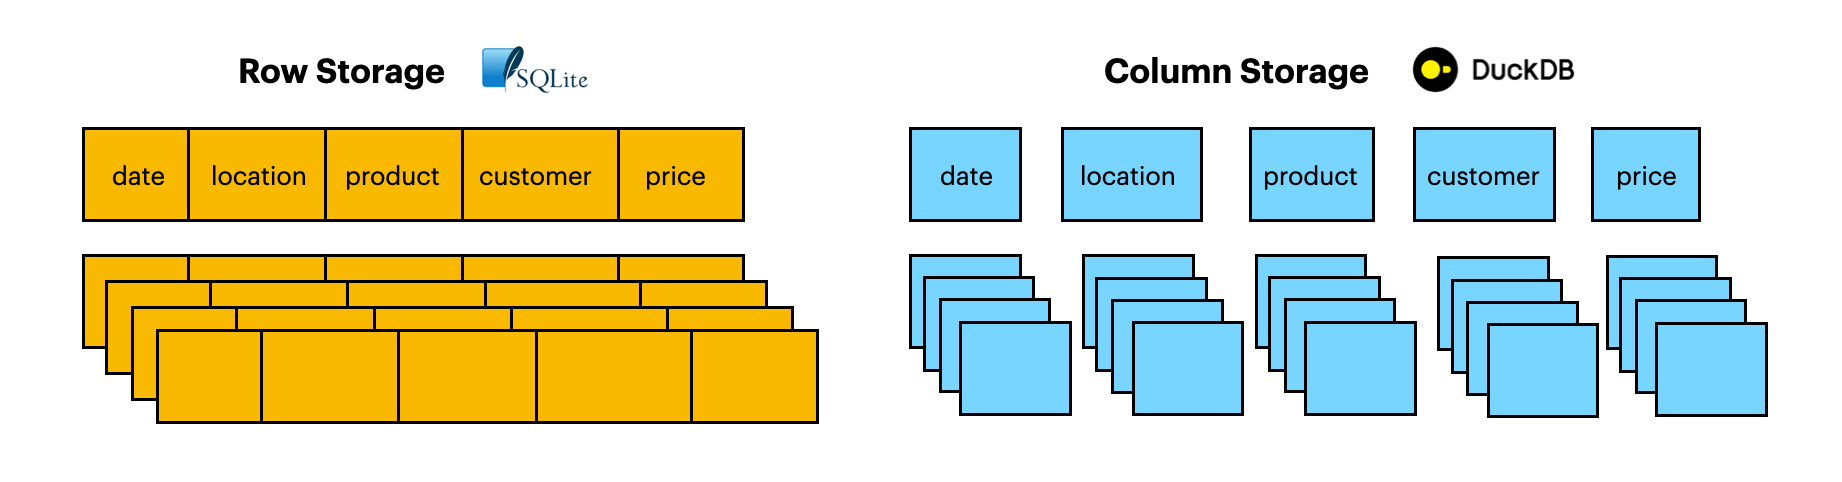
- It uses columnar data storage. With column storage, you’re able to fetch individual columns cheaply. Let's say you're working with a super wide 1TB table with 100 columns but you only want to query 5 columns. With row storage (e.g., SQLite), you would need to read the entire 1TB of data from disk. With column storage, you would only need to read 5 of the 100 columns. This makes things much more efficient and can significantly reduce the query execution time!
Despite handling complex operations behind the scenes, DuckDB has a straightforward user interface that makes it so easy for anyone to get started. Let’s dive into a demo to see DuckDB in action.
DuckDB in Action
For this demo, we'll explore the NYC Yellow Taxi Trip dataset from Kaggle using a Python environment. This dataset is set up as 4 different csv files:
yellow_tripdata_2015-01.csvyellow_tripdata_2016-01.csvyellow_tripdata_2016-02.csvyellow_tripdata_2016-03.csv
To load a single csv file, we can query the csv file directly like this:
import duckdb

duckdb.sql("""
SELECT *
FROM 'yellow_tripdata_2015-01.csv'
LIMIT 5
""")
returns:
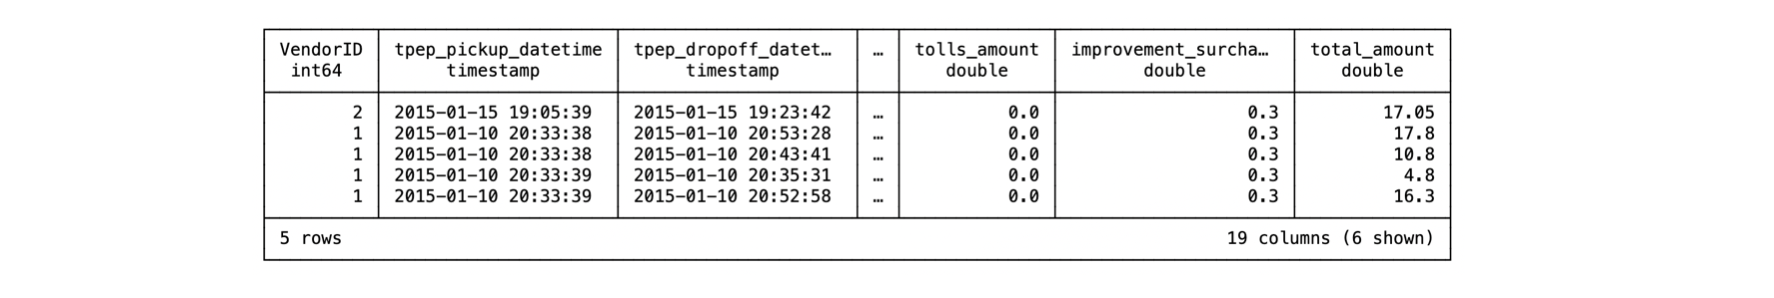
It's pretty amazing that you can reference csv files directly in a SQL query. To inspect the schema of the table, we can use the DESCRIBE function like this:
duckdb.sql("""
DESCRIBE SELECT *
FROM 'yellow_tripdata_2015-01.csv'
""")
returns:
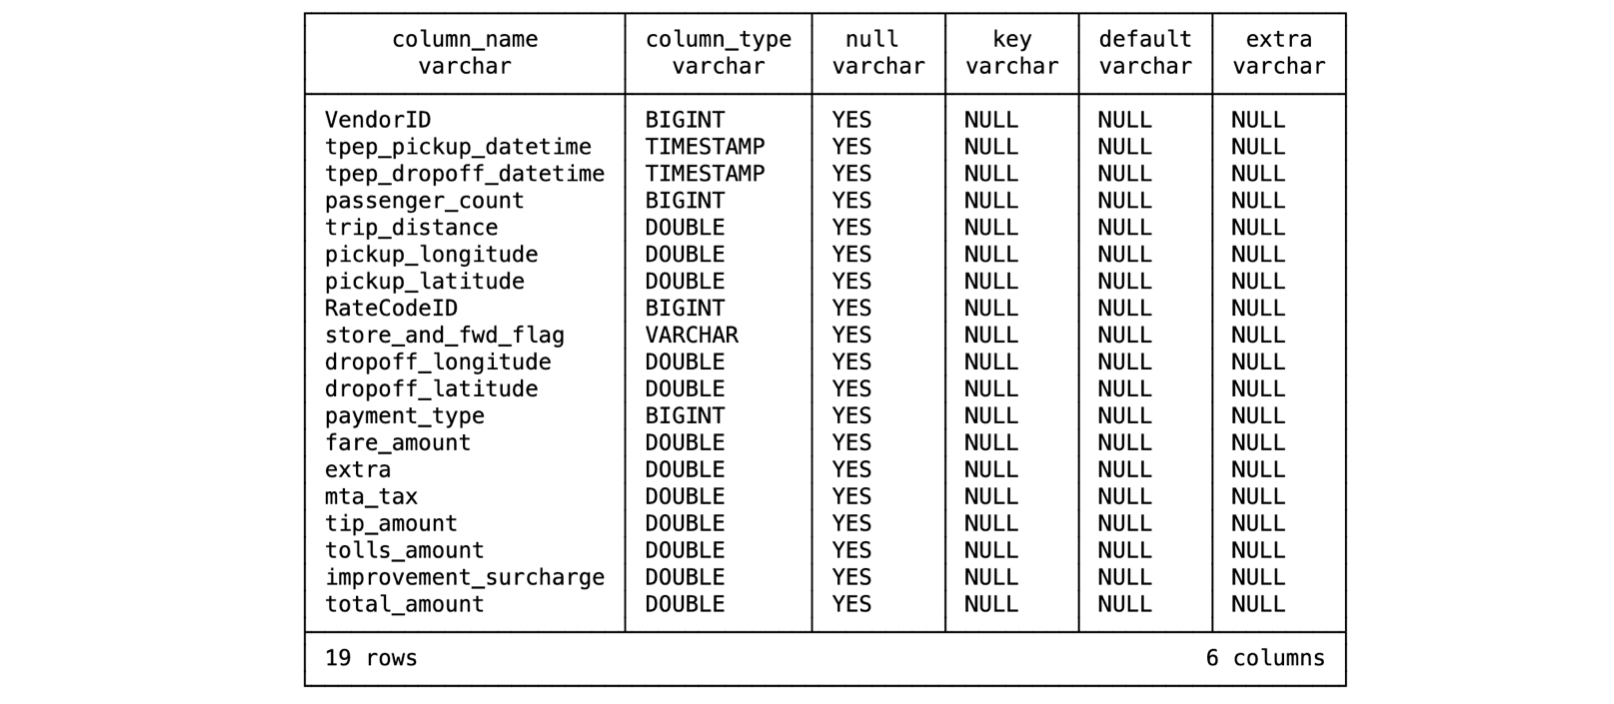
DuckDB's DESCRIBE is pretty similar to Pandas' version of describe() which gives you a nice summary of the data you're working with. If you're not familiar with SQL datatypes, here's a mapping of how these datatypes correspond to Python's datatypes:
| DuckDB's SQL | Python |
|---|---|
| BIGINT | integer |
| DOUBLE | float |
| VARCHAR | string |
| TIMESTAMP | datetime |
To load all 4 files and concatenate them, you can simply use a wildcard to indicate that you want all csv files that start with yellow_tripdata:
duckdb.sql("""
SELECT *
FROM 'yellow_tripdata*.csv'
""")
This wildcard feature is a game-changer!! If I were using Pandas, I’d need to load each individual file into a dataframe and then use pd.concat() to combine them. With DuckDB, there's no need for that extra effort. 🤩
Relation Objects
It's important to note that the output of duckdb.sql() is NOT a dataframe but rather a DuckDB "relation object". It holds very little space. For example, the output of this code is just 56 bytes:
duckdb.sql("""
SELECT *
FROM 'yellow_tripdata*.csv'
""")
However, materializing this relation object into a Pandas DataFrame inflates its size to 9.54GB. Relation objects make it possible to query large amounts of data without running into memory issues or crashing your Jupyter notebook kernel.
One of my favorite features of DuckDB is that you can assign a relation object to a variable, and refer to that variable as if it were a SQL table in other queries. For example, let's assign the output of the 4 concatenated files to a variable called all_files:
all_files = duckdb.sql("""
SELECT *
FROM 'data/yellow_tripdata*.csv'
""")
Now, we can call all_files in a new query as if it were a SQL table. Let's aggregate the data by month and count the number of rows:
duckdb.sql("""
SELECT
    datetrunc('month', tpep_pickup_datetime) as month,
    count(*) as n_rows
FROM all_files
GROUP BY 1
""")
returns:

This is an amazing feature that lets you break a large query down into smaller parts.
Interoperability with Pandas
DuckDB is great for processing large amounts of data. But if you ever need to create data visualizations, you'll need to convert your DuckDB data into a Python-based dataframe like Pandas. Luckily, this is very easy to do.
Let's say we want to plot the average tip amount by day of week. First, we can crunch the data with DuckDB:
tips_by_day_of_week = duckdb.sql("""
SELECT
    dayname(tpep_pickup_datetime) as day_name,
    avg(tip_amount) as avg_tip_amount
FROM all_files
WHERE tpep_pickup_datetime >= timestamp '2016-01-01'
GROUP BY 1,2
ORDER BY 1
""")
Then we can convert this into a Pandas DataFrame:
tips_by_day_of_week_df = tips_by_day_of_week.df()Now, we can use this Pandas DataFrame to build a Seaborn barplot:
import seaborn as sns
import matplotlib.pyplot as plt

sns.barplot(
    x='day_name',
    y='avg_tip_amount',
    hue='avg_tip_amount',
    data=weekly_amounts_df,
).legend_.remove()
plt.xticks(rotation=90)
plt.ylabel('avg tip amount (USD)')
plt.xlabel('day of week')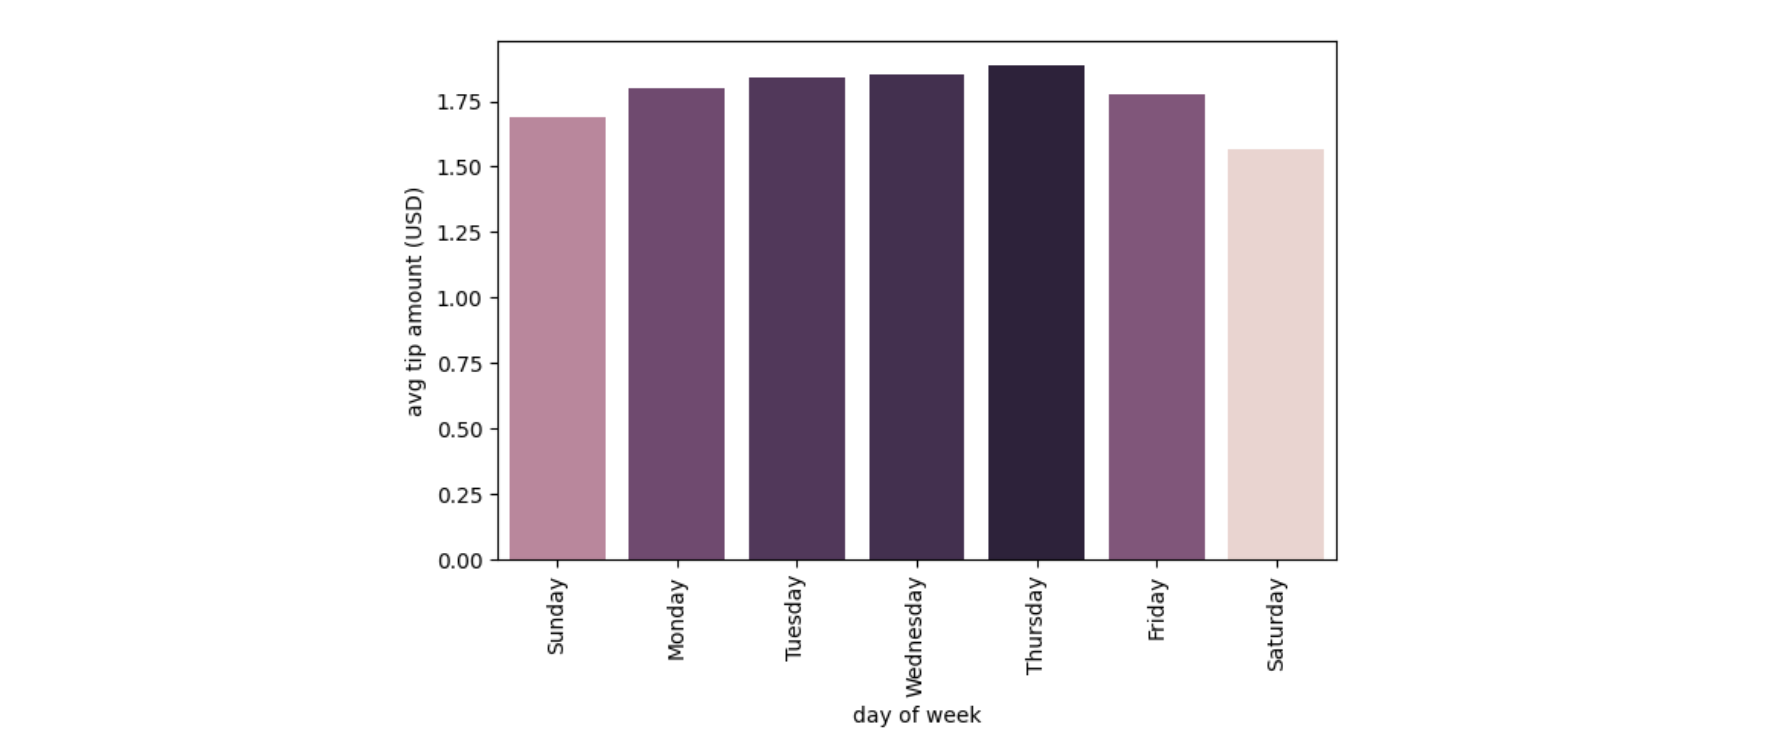
This is great! Pairing DuckDB with Python libraries like Pandas and Polars allows for streamlined end-to-end data analysis. You can leverage DuckDB for efficient data transformation and cleaning using SQL, and then use Pandas or Polars for downstream analysis or machine learning modeling.
Benefits of DuckDB
In conclusion, I believe that DuckDB is a powerful embedded database that can 10X the efficiency of a data pipeline. Here are the benefits that stand out most to me:
- Great for SQL enthusiasts (and ChatGPT users). DuckDB's SQL syntax closely resembles PostgreSQL's syntax, which is widely adopted in the developer community. Given PostgreSQL's extensive documentation, ChatGPT is more likely to excel at working with DuckDB compared to newer Python libraries.
- Very lightweight. DuckDB has a very small footprint because it has no external dependencies. DuckDB is also extremely easy to set up. If you're using DuckDB in a Python environment, you simply need to pip install
duckdband you're good to go! - Interoperable with Pandas and Polars. The beauty of DuckDB is that it can do the heavy lifting of data processing using SQL and can easily be converted to a Pandas or Polars dataframe for further analysis or visualization.
For me, DuckDB has been a game-changer: it’s lightweight, fast, and flexible enough to fit into almost any data workflow. It reminds me that sometimes the best tools aren’t the flashiest — they’re the ones that are easy to use and can work with your existing workflow. If you haven’t tried it yet, I highly recommend checking it out – let me know how it is. 😊